AAC in English-speaking countries: Survey Results

  • 12 minute read

During AAC Awareness Month an online survey was conducted to learn more about the state of Augmentative and Alternative Communication (AAC) in the English-speaking world. Three years after the last survey, we wanted to get a better understanding of current practices and challenges.

In the last 6 years the Augmentative and Alternative Communication (AAC) landscape has significantly changed. AAC apps on consumer devices have led to a democratization of high-tech AAC. Many individuals are now obtaining AAC solutions through non-traditional pathways and alternative funding sources. Yet, knowledge of and experience with AAC best practices has not spread at the same pace. A 2012 exploratory survey revealed that few AAC users and families of AAC users felt they were getting good professional AAC implementation support.

Now, three years later, we want to get a better understanding of current practices and challenges. A new exploratory survey was conducted during AAC Awareness month. In three separate surveys we collected information from AAC users (34 respondents), family members of AAC users (182 respondents), and professionals working with AAC users (346 respondents). About 20% of the family members reported on adult AAC users and 80% reported on child AAC users. In the analysis below we separate out those two groups of AAC users.

The survey was designed by AssistiveWare together with Carole Zangari and Jane Farrall. The survey was shared through blogs, newsletters and social media in the US, Canada, Australia and the UK.

In this blog post we will share basic statistics for most of the questions from the AAC users and family members of AAC users surveys. In later blog posts we will share information on the survey for professionals, cover additional questions and present a more in-depth analysis.

Disclaimer

Because the survey was shared through blogs, newsletters, Facebook and Twitter the sample is biased towards people with a keen interest in AAC. The results thus represent the more knowledgeable segment of AAC users, family members, and professionals. Nonetheless, some patterns emerge across all three groups of respondents providing confidence in emerging trends.
Basic Statistics

Child AAC Users (reported on by family)Adult AAC users (reported on by family)Adult AAC users (self-reporting)
Number of respondents1473534
RespondentsParent or family member: 97%
Caregiver: 3%
Friend: 1%
Parent, spouse or family member: 97%
Caregiver: 3%
Part-time AAC user: 59%
Full-time AAC user: 41%
AAC user’s age0-5 years: 22%
6-11 years: 45%
12-18 years: 33%
19-24 years: 57%
25-35 years: 34%

35+ years: 9%
19-24 years: 26%

25-35 years: 29%

35+ years: 45%
AAC user’s genderFemale: 32%

Male: 68%
Female: 43%

Male: 57%
Female: 62%
Male: 38%
Most common diagnosesDevelopmental delay: 32%
Cerebral Palsy: 20%
Autism: 33%
Angelman Syndrome: 25%
Developmental delay: 37%
Cerebral Palsy: 34%
Autism: 29%
Angelman Syndrome: 14%
Developmental delay: 6%
Cerebral Palsy: 41%
Autism: 29%
Angelman Syndrome: 0%

It appears that many of the self-reporting adult AAC users are part-time AAC users (note that we did not ask about part-time AAC use in the survey for family members). The importance of part-time AAC use is something we sometimes forget about.

In the survey for family members there are more male AAC users among children and to a lesser degree among the adult AAC users. In the survey for AAC users there are instead more females than males. We don’t believe these differences are necessarily representative of all AAC users. But, it is important to keep this kind of information in mind when looking at the answers provided on the other questions. For the family member survey there were many respondents with a child or adult with Angelman Syndrome. This is probably related to extensive sharing of the survey in that community.

AAC devices

Graph showing various device usage
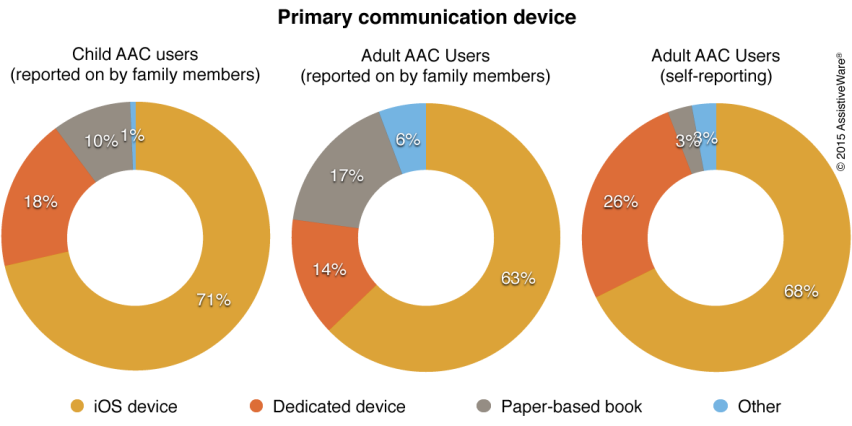
Primary communication device statistics

Across all ages there is a clear dominance of iOS device use. This may be related to the fact that many of the AAC users started using high-tech AAC six years or less ago, after AAC apps became available on consumer devices. While many of the adult AAC users are old enough to have used high-tech AAC before the advent of mobile AAC apps, it looks like many only started to use AAC after these apps came on the market. We also asked questions about the use of a secondary device and/or paper-based backup. Many AAC users use more than one AAC system. In a later blog post we will look at this in more detail.

Child AAC users (reported on by family)Adult AAC users (reported on by family)Adult AAC users (self-reporting
Most common appsProloquo2Go: 60%
Speak for Yourself: 11%
Tobii Dynavox Compass: 9%
TouchChat: 6%
Proloquo2Go: 77%
Speak for Yourself: 9%
Proloquo2Go: 30%
Proloquo4Text: 22%
Verbally: 9%
Predictable: 9%
Most common dedicated devicesPRC device: 26%
Tobii-Dynavox device: 41%
Saltillo device: 7%
PRC device: 40%PRC device: 50%
Lightwriter: 30%
Duration of high-tech AAC use0-3 years: 63%
4-6 years: 28%
7-10 years: 5%
11+ years: 4%
0-3 years: 11%
4-6 years: 26%
7-10 years: 31%
11+ years: 32%
0-3 years: 32%
4-6 years: 18%
7-10 years: 15%
11+ years: 35%
Most common access methodsDirect access: 82%
Keyguard: 10%
Eye gaze: 8%
Direct access: 74%
Keyguard: 17%
Eye gaze: 14%
Direct access: 82%
Keyguard: 12%

As can be seen in the table above PRC devices are used more by the adult AAC users and Tobii-Dynavox devices are used more by the younger AAC users. This appears to be related to the popularity of PODD, which is available on the Tobii-Dynavox devices, but not on the PRC devices.

In both groups direct access and keyguards are the most common access methods. The newer eye gaze method is also quite common for the mostly younger AAC users reported on by their family members.

Vocabulary and grid sizes

Child AAC users (reported on by familyAdult AAC users (reported on by family)Adult AAC users (self-reporting)
Most common vocabulariesCore word based vocabularies
Basic and contextual vocabularies
PODD
Core word based vocabularies
Basic and contextual vocabularies
Core word based vocabularies
Text-based solutions

Many children do not use a robust vocabulary, even when they use apps or devices offering such robust vocabularies. We will investigate this later in more detail. However, the good news is that, also in this group, there is still a significant number that does use a robust core word or PODD vocabulary. Most of the self-reporting adults use either a text-based AAC system or a robust core word vocabulary.

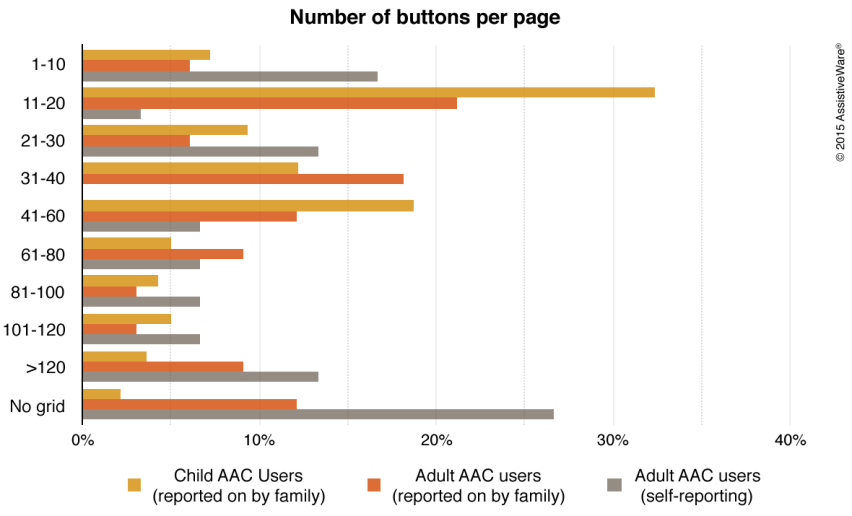
Number of buttons per page

In the graph above you can see that almost 40% of the children use grids with 20 or less buttons per page. For the adult AAC users reported on by their family members the corresponding number is 27%. For the self-reporting adults it is 20%. Grid sizes of 20 or less buttons are relatively small for an effective core word implementation.

Middle of the road grid sizes between 20 and 60 buttons are common for children (40%) and the adults reported on by their family members (36%). For the self-reporting adults only 20% uses middle of the road grid sizes, while another 20% uses really a large grid size of 100 buttons per page. In general, we can see a progression from small grids used by children to an increase of larger grids and non-grid text-based systems used by adults.

Customization

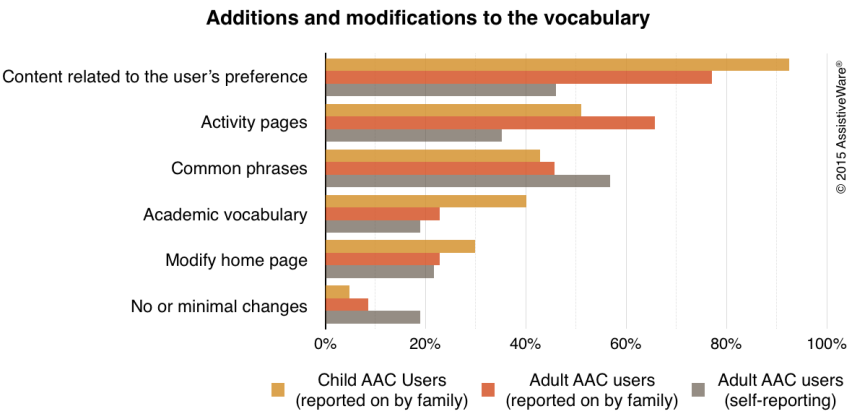
Graph titled additions and modification to the vocabulary

Few AAC users use a system without any form of modification. Over 75% of family members report adding and changing content to match the user's preferences. This may include things such as foods, friends and other personal content. About 50% adds activity specific pages for children and almost 70% does so for adult AAC users. Over 40% adds common phrases and about 40% adds academic vocabulary for children to support their school work.

Almost 60% of the self-reporting adult AAC users adds common phrases. About 45% adds content related to their personal interests and preferences. About 20% makes no changes. We have not investigated this yet, but this might be because they type most of their messages directly.

Child AAC users (reported on by family)Adult AAC users (reported on by family)Adult AAC users (self-reporting)
Most common changes to visual supportsNo changes: 18%
Selective customizations of photos and pictures: 59%
Replace symbols with photos: 8%
No changes: 23%
Selective customizations of photos and pictures: 57%
Replace symbols with preferred symbol set: 6%
No changes: 40%
Selective customizations of photos and pictures: 26%

Forty percent of the adult AAC users does not change the visual supports at all. Only 26% adds some photos and pictures. Compared to the adult AAC users, the family members report more changes to the visual supports.

Less than 25% of the family members reports making no changes to the visual supports. Almost 60% adds at least some photos and pictures, while 8% replaces the symbols in the AAC system with photos.

Use of AAC

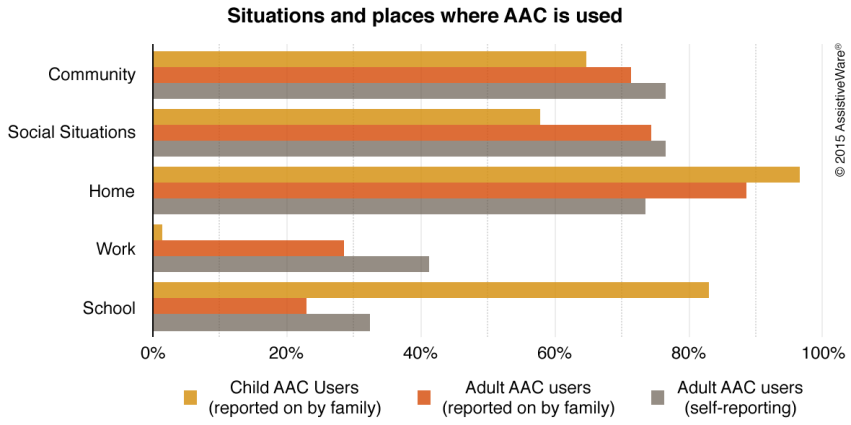
Graph entitled Situations and places where AAC is used

All three groups use the AAC system in many different situations. Naturally, school use is high for children and work use is higher for adults. A progression can be observed with increased use of AAC in the community and social situations as users get older and become more independent. Home use instead appears to decline a bit with increased independence, which might be due to adults living alone (and thus not communicating at home) and/or an increased range of alternative ways to be understood. Some adults also report that families object to their use of AAC, which may also explain less use at home. Finally, many of the self-reporting adults are part-time AAC users and may need AAC least in an environment where they feel at ease.

Benefits of AAC

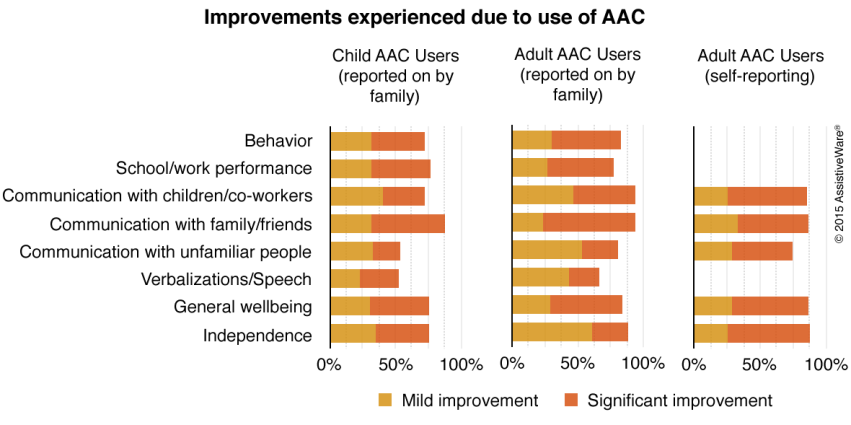
Graph entitled Improvements experienced due to use of AAC

For all three groups the use of AAC leads to some key benefits that extend beyond communication itself and include general wellbeing and independence. In the adult AAC users survey we did not ask about behavior, school/work performance and verbalization/speech because after consultation with some adult AAC users those questions were not considered entirely appropriate to ask. Hence, there are no data points for those categories in the graph above. When looking at the graph one can see that while all three groups experience improvements due to the use of AAC, improvements tend to be more significant for adults.

Communication functions

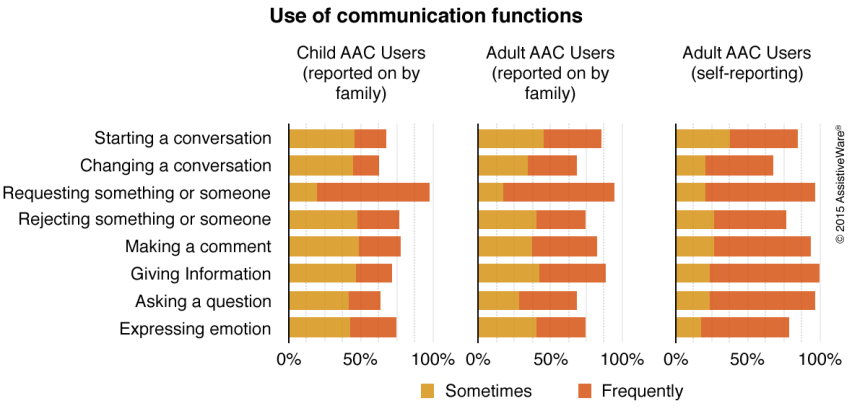
Graph with use of communication functions

Clear differences are reported in terms of the communication functions used. The young AAC users reported on by their family members use the system primarily for requesting and to a much lesser extent for other communication functions. The adult AAC users use a wider range of communication functions frequently. Those adults that completed the survey themselves report using the widest range of communication functions. They use the system more often for giving information than for requesting. Requesting, making comments and asking questions are other frequently used communication functions in this group. These results are consistent with what you would expect as AAC users mature and learn. It will be interesting to see whether there is any relation between communication functions and learning strategies or duration of high-tech AAC use. We will need to look at this more closely in further analysis.

Teaching strategies, device availability and sentence length

Family members of AAC Users
Most frequently used strategiesProvide regular, reliable communication opportunities within day-to-day activities: 60%
Modeling: 60%
Timing (give more time to respond, expectant pauses): 58%
Device on which modeling is doneAAC user’s device: 86%
Separate device similar to the user’s device: 36%
Paper book: 24%
Percentage of the day device is availableAll day: 54%
Three-thirds of the day: 23%
Half of the day: 10%
One-fourth of the day or less: 10%
Most common sentence length2-3 words: 45%
Single words: 21%
4-5 words: 19%
More than 5 words: 12%

We only asked family members about teaching strategies. They report using key teaching strategies such as modeling and providing communication opportunities. Further analysis is needed to determine whether these numbers may be biased by the more knowledgeable respondents attracted to the survey.

Biggest Challenges

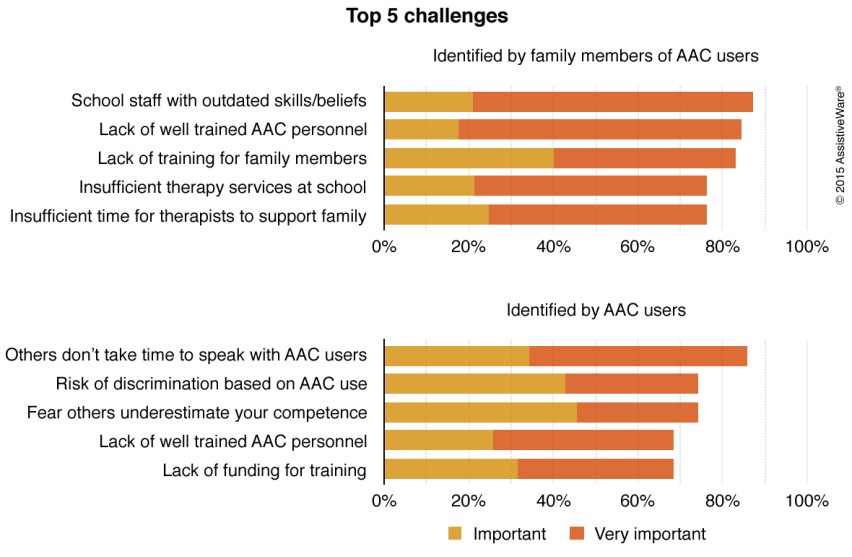
Graph with Top 5 challenges

As seen above both groups of respondents report lack of well trained AAC personnel as a top challenge. Lack of training and funding for training also appear as key challenges. The adult AAC users also report several social challenges in terms of how people respond to AAC use. These kinds of challenges were not included in the survey for family members, yet they are likely to play a role for AAC users cared for by their family too. Family members also mentioned outdated beliefs of school staff and insufficient therapy services as key challenges.

Conclusions

In this blog post we have shared the initial results of the survey for family members of AAC users and the survey for adult AAC users. We have not yet covered every single question and have only done a superficial analysis so far. Yet, there are a number of striking results:

  • iOS devices are the most popular AAC system For children and adults alike iOS devices have come to be the most common primary AAC device. But dedicated devices and paper-books continue to be important as primary and/or secondary device.
  • Not all AAC users have access to a robust symbol-based vocabulary or text-based AAC system We will look at this in closer detail in a later blog post, but generally speaking it looks like the adults that completed the AAC survey themselves have some of the most robust AAC systems. These users also have some of the largest grid sizes, which means they have quick access to a lot of language with minimal navigation needs. However, for all groups there is quite a range of grid sizes in use. It is concerning that as much as 40% of the children have access to 20 buttons or less per page.
  • AAC provides benefits beyond communication Across all groups we see AAC used in a wide variety of situations. Benefits beyond communication are experienced by child and adult AAC users, including improvement of general wellbeing and independence.
  • Many AAC users use a limited range of communication functions About 20% of the children does not get beyond requesting and about half of the children only sometimes use other communication functions. Adults reported on by their family members use a slightly wider repertoire of communication functions on a regular basis. The self-reporting adults regularly use a wide variety of communication functions, but changing a conversation, expressing emotion or rejecting something or someone are only used frequently by about half of the respondents. So despite the improved communication reported by the vast majority of respondents, there is still a lot of room for further improvement in the form of expanding the repertoire of communication functions.
  • Lack of knowledge about AAC is a major challenge Many family members and adult AAC users report that the personnel that is supposed to support them lack AAC knowledge. Family members often need to fight school staff with outdated ideas or beliefs about AAC. Both groups see few opportunities to be trained in AAC use. Adult AAC users in addition see the way others respond to AAC use as a major challenge.

We look forward to sharing more results in future blog posts!

Share this article

Authors

Written by